 Metrics and Assessment
Continuous assessment of the effectiveness of facilitation practices, including the evaluation of facilitation impact as tied to user feedback, as well as evaluating changes in the patterns of ACI utilization by different users and groups, changes in user demographics over time, etc., to improve and remodel facilitation efforts and to assess overall impact
- Introduction
1.1 Definitions
1.2 Assessment Planning - Use of Metrics and Assessments
2.1 Program Evaluation
2.2 Facilitator Evaluation
2.3 ROI or Impact Evaluation
2.4 Training Evaluation - Types of Metrics and Assessment
3.1 Metrics
3.2 Assessments - Tools for Collecting and Analyzing Data
4.1 User base metrics
4.2 Resource usage metrics
4.3 Facilitation metrics
4.4 Facilitation Assessments
4.5 Return on investment (ROI) metrics - Summary
- References
Introduction
ACI organizations are often called upon in order to evaluate the services and to demonstrate the value provided to the research community and institution; therefore, ACI organizations can provide data on the usage of ACI resources and demonstrate the effectiveness and impact of the different aspects of ACI facilitation. In addition, metrics also provide the Facilitator and other team members with an ability to assess user behavior, detect issues, and identify ways that ACI systems and facilitation efforts can be improved to better meet user needs. In the spirit of if you cannot measure it, you cannot improve it, the assessments and metrics described here will help Facilitators measure the impact of facilitation for the purpose of improving their services as well as for setting priorities and future goals.
The information presented in this chapter represents a collective understanding of the data and metrics of ACI resources and facilitation that are most valuable as well as manners in which the data can be used. The metrics to be collected and the assessments to be performed will vary across sites as was found to be the case for the six institutions that participated in the ACI-REF project. The differences are due to the variation in the ACI organization in terms of both the resources available and the services provided as well as differences in operational policies. However, even with the differences, similarities were readily identified.
Definitions
In order to establish a consistent framework describing the information to be collected, it is important to define how the terms metrics, assessment data, and evaluation will be used.
A metric is defined as directly measurable and quantitative information that, in this case, will be used to track ACI resource performance, use, and facilitation. Metric data may include ACI usage patterns, attendance at training events, Facilitator interactions, and any other information that can be measured to demonstrate the progress and/or impact of facilitation services. Metrics are objective and sentiment neutral.
Assessment data is information collected from researchers (or other individuals) regarding their perception of some aspect of ACI services, including aspects of Facilitation, or of a researcher’s self-assessment of their own capabilities. Even when represented as a quantitative value (perhaps a numerical score), information from assessments is generally indicative of some qualitative reflection on a personal experience with ACI resources, including facilitation activities such as training. We will refer to facilitation assessment as a method for collecting information that can be used to measure the effectiveness of Facilitation activities, along with providing information on ways to improve the activities, or shift effort between them. A facilitation assessment can be a survey administered after a training session to provide feedback on its value, a quiz to determine a user’s level of ACI knowledge (and change in abilities following a training), or a survey on the current ACI resources offered to determine whether or not they are meeting the needs of the user community.
An evaluation refers to the process of drawing conclusions about the activity, project, or program being studied based on the metrics and assessment data collected. Evaluations are used to make decisions at all levels: for example, the you may have to decided whether or not to add another training session to your Facilitation program which might be based on the results of assessing workshop attendance metrics and workshop attendee feedback. As a second example, determining whether or not ACI resources are meeting the needs of a user community might be one component of an evaluation of ACI resources.
Assessment Planning
Assessments provide essential knowledge that can be used to understand the aspects of the project are working well and which are not and therefore need be modified1. The purpose of an assessment plan is to improve the project or to demonstrate its effectiveness. The plan’s goals will be defined in the context of the ACI organization or larger institution’s mission, and the plan’s outcomes will demonstrate the achievement of its goals2. It is crucial that the plan be adaptable so that activities and services can be changed if necessary to improve the overall project outcome. The assessment process must include the collection of the most complete and correct set of information in order to allow for a convincing outcome, including the impact of the project. The plan must also take into account the various stakeholders and identify their specific interests, goals, and/or expectations which can be distinctive across different groups.
The first step of developing an assessment plan is to review or establish the goals of the ACI organization’s facilitation. Then, keeping in mind the activities and services that are currently offered, begin to list questions that will need to be answered to demonstrate that the goals are being achieved. The questions may be at any level: “What is the effectiveness of our training program, and how can it be measured?” or “Has the number of core hours used by medical school researchers increased over time, in light of recent efforts to increase it?” The Facilitator should ask their supervisor for input and collect additional questions from ACI team members to further expand and refine a final operational list. The list may be prioritized based on immediate or long-term goals or on questions that can be answered most readily from the data that is currently collected. The next step is to identify the data that will be needed to answer the questions. These may include automated accounting metrics like those produced by compute scheduling tools (i.e. SLURM, HTCondor, Torque/Moab), or survey questions that are posed to ACI users. Along with identifying the the data to be collected, the manner of data collection must also be selected. The following sections of this document will assist Facilitators with these tasks.
Jump to: top
Use of Metrics and Assessments
An analysis of the assessments and metrics can be used to evaluate an institution’s facilitation program, to determine if its services are meeting the needs of its users and organization. The results may be used to effect change and guide decisions within the ACI organization.
Program Evaluation
An evaluation of an organization’s facilitation program should first of all provide answers to practical and immediate questions, such as how well the Facilitation program is meeting the needs of its user population. The evaluation can be focused on identifying gaps in the facilitation services provided, including the ACI resources available and the ways that these gaps can be addressed. For example, an annual evaluation of services, before or after a new academic year, enables the ACI organization to better plan for the coming year. Alternately, if you have been doing continuous evaluations, taking a step back to reflect on the results over the course of a year is recommended. In addition to helping to identify what is working well and where there are needs for improvement, the process can
- help identify clear areas of growth opportunities for the organization
- allow for the setting of specific goals for improvement in the future
- guide the setting of priorities, especially when choices must be made between resources and/or services to be offered
This process should involve identifying specific steps that can be made to improve the ACI organization as a whole, including the facilitation efforts. As an example, the results of a training evaluation can be used to identify training that may need to be updated and/or modified due to changes in resources or procedures, be adapted to new training requirements, or is no longer of value.
Facilitator Evaluation
Metrics and assessments can also be used to evaluate a Facilitator’s performance. The evaluation might take the form of a self-evaluation, a discussion with the team or a supervisor, or have the formal structure of an employer evaluation. Evaluations can be made based on the contributions made by the Facilitator, such as on the:
- success of a given training session, especially if there were surveys with questions that specifically addressed the Facilitator
- success of an outreach event that may have led to an increase in new users, especially from non-traditional departments
- number of engagements with researchers and the quality of assistance
They can also be made based on the impact of those contributions on the success of facilitation or the overall success of the ACI organization. This evaluation can also be used as an opportunity to review the process surrounding facilitation tasks and perhaps identify tasks that can be automated.
Periodically, Facilitators should reflect on their accomplishments, note areas where they see a need for improvement, and set goals for the future. It is useful to obtain regular input on these from others in the ACI organization. Regular performance reviews can sometimes be leveraged to accomplish this, especially if they include both self and supervisory evaluations. However, if regular performance reviews do not occur or if the review does not contain a self-assessment component, the Facilitator can take steps to evaluate themselves. This process allows the Facilitator to stay engaged and to keep up with the ACI organization’s changing needs.
ROI or Impact Evaluation
Lastly, an evaluation of the impact, or the Return on Investment (ROI), of the ACI organization is an important component of the organization being able to justify their existence and the institutional resources they receive; this same impact evaluation applies to the funding which supports the facilitation effort. With the reality of many programs competing for limited resources at an institution, having the ability to show the ROI for the ACI spending as well as having concrete, specific examples, such as research that was achieved through the use of the ACI resources or additional funding that was obtained based on research resulting from the use of the resources, will greatly benefit the organization. This information is very useful for incorporating into budget justifications and when reporting to a user advisory committee, Vice Principal of Research, or Chief Information Officer, etc., to show a growing need for the resources.
Training Evaluation
Before discussing specific metrics and assessments types, we will cover the salient features of the Kirkpatrick Model, developed in 1959 and considered to be the standard for training evaluation3. This model defines four levels of assessment, as a hierarchical approach to understand the impact of training.
- Reaction: The response or perception of the participants to the training, including the content, the instructor, and the learning environment
- Did they feel it was a valuable experience?
- Did they find the training engaging and relevant?
- Learning: The degree to which participants acquired the intended knowledge or skills
- Did the knowledge or skill level of the participants on the subject increase?
- Did the training change the attitude of the participants to the subject?
- Behavior: The ability of the participants to apply the knowledge gained
- Did the participants use the knowledge gained?
- Did the participants change their behavior?
- Results: The tangible outcomes that occurred as a result of the training
- Were the participants of training shown to have better performance?
- What is the return on the investment (ROI) made in training?
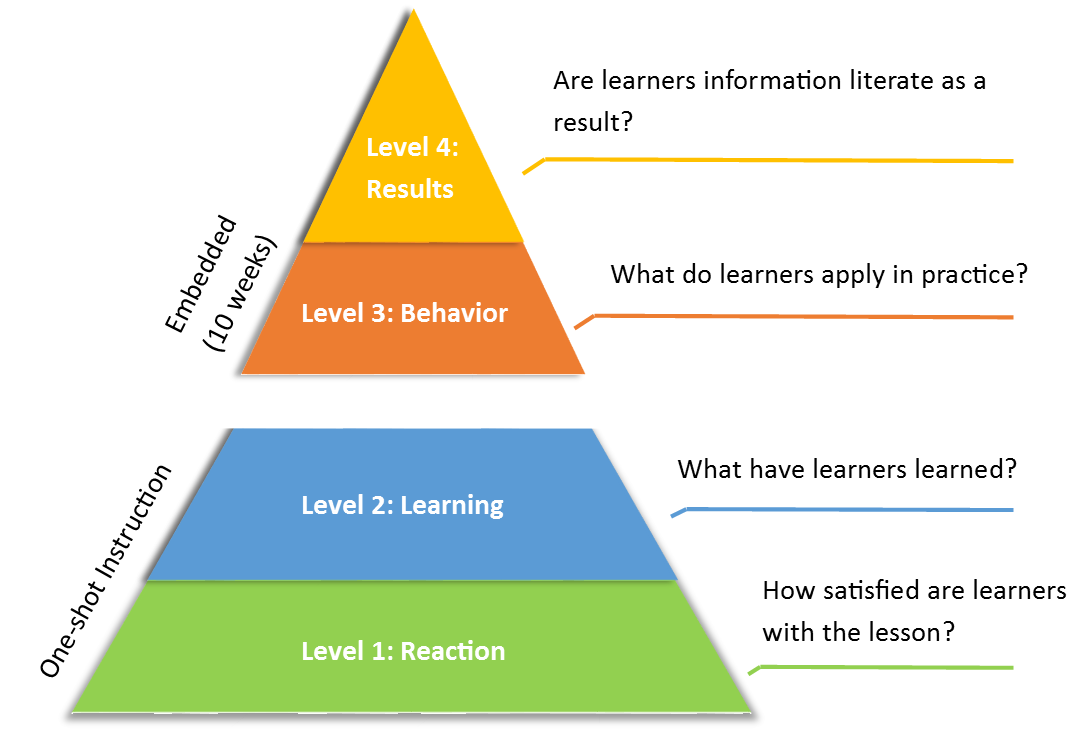 Figure 1. Levels of training evaluation in the Kirkpatrick model
Figure 1. Levels of training evaluation in the Kirkpatrick model
Figure 1. Levels of training evaluation in the Kirkpatrick model
These four levels are often represented as a pyramid, as shown in Figure 14, emphasising the manner in which the higher levels are built upon the foundation established by the previous levels – and thereby emphasizing the importance of the quality of the training sessions.
While measuring the effectiveness of training on these multiple levels is possible, it can be difficult and time consuming. It is relatively easy to generate and give a simple survey which addresses the first two of these four levels and which will provide valuable feedback on the material and the presentation (see survey section below). However, moving beyond a Level 1 reaction evaluation requires that the training participants be tested, interviewed, surveyed, or observed, possibly before the training event and certainly after the event, and perhaps at several selected intervals afterwards. Moreover, to be able to truly conclude that changes in outcomes (i.e., changes in behavior or results) were influenced by a training program, it is usually necessary to design and implement the training as part of a rigorous study. Of course, one must weigh the potential outcomes with the time and cost of the doing the evaluation. Furthermore, learner feedback and observations of their experiences can be obtained more informally, in the form of real-time discussion during the training, semi-anonymous input (i.e., the Software Carpentry model of periodic feedback on post-its), and later discussions that the Facilitator may have with researchers who attended a past learning experience.
Jump to: top
Types of Metrics and Assessment
In this section, we discuss metrics and and assessment techniques that we have found valuable in our attempts to evaluate the impact of the facilitation efforts implemented as part of the ACI-REF project.
Metrics
The metrics discussed below include the metrics that the schools report monthly as well as additional metrics that are collected by individual organizations. These include metrics describing aspects of the ACI user base, resource usage, resource performance, facilitation, and return on investment (ROI).
ACI user base metrics
User base data includes the number and types of users. Users can be categorized by their research groups, departments, and/or colleges. It may be useful to also track the users by their field of study as well as whether they are a member of a “traditional” or “non-traditional” ACI user field, noting that this distinction is dependent on the institution. The specific categories will also depend on the institution and the ACI organization. This data needs to be periodically recorded in order to track growth metrics.
Resource usage metrics
Resource usage metrics will vary for different ACI systems and services but may include the number of core hours used, the number of jobs run, and the number of users leveraging the resources over different time periods. The usage can also be further divided into the usage based on research groups, departments, colleges, as well as traditional/non-traditional users, provided the users of the resources can be categorized into these groups. An example is shown in Table 1.
Table 1. A typical example taken from an ACI-REF monthly report on ACI user/project base and resource usage metrics, by category and department type
| June 2016 Compute Metrics | Totals | Traditional* | Non-Traditional* |
| ACI Users on Campus | 338 | 219 | 73 |
| ACI Depts on Campus | 38 | 18 | 19 |
| New HPC Projects | 5 | 0 | 5 |
| New UPC Users | 11 | 5 | 6 |
| Jobs Run | 89904 | 63784 | 18104 |
| Core Hours | 904681 | 682597 | 217084 |
Facilitation
It is important to quantify the facilitation efforts of both the Facilitator as well as other members of the ACI staff. This includes tracking the number events held and the number of attendees at these events. An example is shown in Table 2. Different types of facilitation interactions such as education, training, outreach, and engagements should be tracked separately. The results of surveys and other activity assessments, discussed in the next section, are an additional metrics that can be used to measure facilitation efforts.
Table 2. A typical example taken from an ACI-REF monthly report on ACI Facilitation metrics, by type, number, assistances and department type
| September 2016 Facilitation Metrics | Instances | Assistances Or Attendees (Unique Users) | Traditional Departments* (Unique Users) | Non-Trad. Departments* (Unique Users) |
| New user meetings | 2 | 5 (5) | 2 (3) | 1 (2) |
| Office hours | 6 | 9 (7) | 3 (3) | 4 (4) |
| Consultations | 2 | 2 (3) | 1 (2) | 1 (1) |
| Email assistance | 52 | 52 (35) | 10 (17) | 10 (13) |
| Workshops | 2 | 14 (10) | 2 (2) | 4 (8) |
| Vendor presentations | 1 | 28 (28) | - | - |
Return on investment (ROI) metrics
Return on investment or ROI metrics are data that can be used to show the impact of the availability of ACI resources to the institution. This includes information on the results of ACI resource use by faculty, researchers, and students, such as funding support, publications, presentations, and dissertations.
Analyses of these metrics can provide valuable, concrete measures of the impact of the facilitation efforts to the various stakeholders, such as the administration of the ACI organization and larger institution, and the project’s sponsoring agency, if relevant. User base metrics can be analyzed to show the evolution of a user community. Resource use metrics can be analyzed to evaluate different aspects of an ACI resource, justifying the funding of the ACI organization and supporting its growth. Independent of the exact metrics data an institution chooses to collect, it is best to collect the data at some periodic interval, such as an academic year, to be able to determine trends in the data. Consistency is also necessary for a meaningful assessment and evaluation of the program. Finally, it is important to periodically review the metrics collected in order to determine if changes, improvements, or additional foci are needed.
Assessments
Assessments usually fall into one of three categories: pre-assessments, formative, and summative. Pre-assessments are made prior to starting a facilitation activity, for example, to determine a user’s technical background and motivation for attending the training. Formative assessments, sometimes referred to as “continuous assessments”, are made over the course of an activity, to determine whether to adjust the implementation of the activity to improve its outcomes. Summative assessments are made at the conclusion of the activity, such as after a training session, or at a specific point in time, such as at the end of a semester, depending on what is being assessed or if implementing a new program after it has been completed or has matured. While assessment data is often quantitative, such as a scaled survey response, it may also be qualitative such as a short answer response on a quiz.
In this section we cover several assessment methodologies that can be used to measure the usefulness of the ACI resources provided and the effectiveness of ACI facilitation efforts.
Surveys
Surveys can be used to solicit invaluable user-reported information and feedback to assess the impact of facilitation efforts and the satisfaction of the user base. It is good approach when there is a need to reach a large number of participants as well as when a set of clearly defined questions can be devised to gain the desired evaluation goal. Surveys are generally easy to generate, to administer, and can result in quantifiable assessments.
Based on the experience and knowledge of ACI-REF Facilitators, we have composed a set of three surveys that can be used to gather information on the user base and their reflections on of ACI resources at key stages of interacting them. Threse three surveys, along with suggested questions are found in the appendix: Entrance Survey, Engagement Evaluation, and Exit Survey. Below is a brief description of the intent of these three surveys:
- The Entrance Survey is designed to be given at account creation or introductory training (if required for resource use) to all users of the ACI resource to gather demographics and previous experience upon entrance. It also can be used to gather information on the user's researching computing needs.
- The Engagement Evaluation can be used in multiple ways. It can be used as a tool to track specific users in a standardized manner but is not necessarily designed to be used for each engagement. It can be used as a mechanism to measure the impact of facilitation as well as to obtain feedback to provide the Facilitator so that they can improve future engagements.
- The Exit Survey is designed to measure the effectiveness of the ACI organization offerings on a per user basis and again is designed to be given to all users of the ACI resource who had one or more significant engagements with a Facilitator. We acknowledge that not all ACI resources or institutions may be notified when a user leaves the institution or no longer needs access to resources due to completion of a project. Therefore, this survey can be utilized on a yearly or other periodic basis.
The results of these three surveys can be used to identify and assess a user population, measure progress for the purpose of reporting and self-assessment, guide improvements to ACI resources, and to guide Facilitator engagements and priorities. It is important to state that these surveys were not scientifically constructed, but rather the surveys represent our best understanding of the data and metrics surrounding ACI resources and their use that are most valuable to capture. We have tried to keep the surveys brief, capturing only necessary information, in order to increase the response rate and the likelihood that their results will be meaningful. The surveys also include open-ended questions to obtain more detailed information, in addition to the typical yes/no or ranking-type questions. By comparing the responses between the entrance and exit surveys, a measure of the self-assessment of users and the development of their ACI skills can be obtained. In the next section, tools that will more readily allow for this type of tracking of responses will be discussed.
As an alternative to surveying individual ACI users, surveys can be administered to specific levels of users or select ACI project groups. As an example, the Center for High Performance Computing at the University of Utah implemented a yearly survey for Principal Investigators (generally tenure track faculty members), to gather data on their ACI needs and the impact of having these resources available at the institution. This provides ROI metrics as well as data that can be used to set priorities on resources and services provided.
As mentioned in the previous discussion of the Kirkpatrick Model, surveys are a quick and simple assessment tool for obtaining feedback metrics for training sessions. Among the ACI-REF project institutions, the most common way to solicit feedback about a training event is to ask general, open-ended questions about what attendees liked or did not like about the activity; for example, “What did you find most helpful about the session?”, “List 2-3 things you liked about the session.”, or “What parts of the session might be improved and how?”, “List 2-3 things about the session you would improve and how.” This approach results in feedback that is specific and helpful for improving a training session.
For a give a quick measure of attendee satisfaction, a scaled rating can be useful. For example, the question “From 1 (awful) to 5 (excellent), how helpful was this training?” would be accompanied by five mutually exclusive (radio) buttons for selecting a response. Finally, providing a “Comments” box is always a good idea, as it allows the attendee to elaborate on their opinion of the training, to highlight a portion that they found especially useful, or to make a specific suggestion on a way the training could be improved. Several sample surveys about training are also included in the appendix of this chapter.
Links to the surveys can be provided as part of the training and, also, be made available on the announcement for the training so that it is easy for attendees to provide feedback. If you require registration for training, participants can be sent a link to the survey. It should be noted that surveys given at different times following the training can be valuable in obtaining information about levels 3 and 4 of the Kirkpatrick model (i.e., the application and impact of the training). While surveys can also be used to gauge the learning (level 2) that occurred, this can perhaps be better obtained with the use of tests, described in the next section.
Polling an audience in real time during an event or training is yet another way to survey a population. As with surveys, polling questions can be designed to be either specific or open-ended. A specific question might ask participants to select the best answer to a question, to test understanding, whereas an open-ended question may result in a wide variety of audience responses that can be analyzed after the event.
However, while surveys are a valuable and widely used assessment tool, it is important that their disadvantages and limitations be understood. In some cases, surveys may lack the necessary depth as a result of supporting only limited responses (i.e., true/false, multiple choice, etc.), or having only a small number of options to make it easier to both complete and analyze. Another consideration is the response rate: if only a small percentage of participants complete a survey, the responses collected may not be an accurate reflection of the entire population, compromising the strength of the results. Larger sample sizes can sometimes be obtained by requiring responses, by sending reminders, or by providing rewards, depending on how important the responses are. The validity of the results can also be questioned if there is no way to know the truthfulness of the responses. Finally, when developing survey questions, care should be taken to frame questions in a manner that does not introduce bias or includes questions might be interpreted in more than one way.
Tests
Testing is a traditional way to assess learner knowledge, and self-quizzes are a popular way to perform formative assessments for new ACI users. Discussed earlier, testing can be used with the Kirkpatrick model, particularly in Levels 2 and 4, for the assessment of training. Self-quizzes are easy to create and administer, and in addition self-quizzes are more reflective and less intimidating than a marked quiz or test. During a self-quiz, users receive immediate feedback and are able to eventually obtain the correct answer. Quizzes can be administered at different times such as after new users receive accounts, a pre-assessment, or after a training session. Results can be kept for student records, and at one school, digital badges are given as a result of successfully completing a training and taking an assessment.
Quizzes can be used to determine if a student has an accurate working knowledge of a specific set of concepts. They are typically multiple choice, criterion-referenced (i.e., they employ a cutoff score to indicate whether or not a student has a sufficient understanding of the subject), and may include “distractor” answers based on commonly held misconceptions – similar in design to a Concept Inventory5, although those are by definition more rigorously and scientifically developed. As mentioned above, the use of testing is typically the method of choice to measure the extent to which training participants learned the material that was presented during a training session.
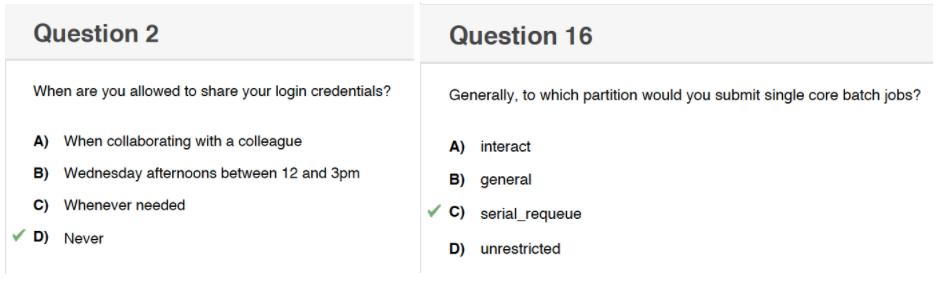 Figure 2: Example of assessment questions from a workshop quiz used by one of the ACI-REF institutions
An example of two questions that were used to assess ACI users’ understanding of ACI policy are shown in Figure 2; the results can be used to provide feedback to the Facilitator on the effectiveness of the information that new ACI users are given. For enhancing learning, feedback can be provided when an incorrect answer is selected.
Observations
Observing, recording, and otherwise documenting what happens during facilitation meetings enables Facilitators to recall, reflect on, and improve the facilitation they perform. Most Facilitators use informal and unstructured observation techniques, but keeping in mind a simple list of things to look for can be useful during meetings with new users and groups. For example, it may be possible through observation to assess if users are aware of your organization’s policies and resources and if they have read your documentation (or perhaps misunderstand the documentation). Observations can also occur naturally at different levels; for example, if a Facilitator notices multiple members of a group setting the same incorrect value when they request resources, then the Facilitator may contact the entire group to discuss the issue.
Observation recordings will have to be shared among Facilitators and other interested staff. Keeping an easily accessed list of recordings will help with accessing and referencing. This is discussed in more detail in the Implementation section of the Engagements with Researchers chapter.
Interviews
Interviews with individual ACI users or groups of users can be used to obtain detailed, individualized information on the impact of the ACI resources and facilitation efforts on their research and can supplement the information obtained through a survey. Interviews can be conducted at a meeting specifically scheduled for the purpose of obtaining feedback, or it can be part of the other interactions Facilitators regularly have with users, such as a follow-up to an engagement. Whether structured, semi-structured, or informal, an in-person interview can result in an engaging, personal, and in-depth exchange of information that is not possible through an email correspondence or survey. In a structured interview, a set of standardized questions and their order are strictly adhered to, yielding a high degree of uniformity in the response set, and enabling responses to be more easily compared. Semi-structured interviews start with a set of questions but allow for deeper inquiry depending on the responses of the person being interviewed. Unstructured interviews are usually thematic, and new questions are based on previous responses6,,7. The results of an interview can be used to develop case studies and success stories which are a powerful way to showcase the impact of ACI resources.
Focus Groups
While a focus group has many of the same features as an interview, the dynamics of a group setting allow for interaction and discussions that can often lead to new insights. Care must be taken to be able to gather the differing thoughts or viewpoints of the group, perhaps by recording the session or by asking participants to submit written responses, either electronically or manually. Focus groups can also take different forms; a few examples that we have found useful in the assessment of ACI resources are given below.
User Council or Advisory Committee: A group whose the members are reflective of different research efforts can have regularly scheduled meetings during which input and feedback on operational decisions can be obtained. An alternative is to have a review committee, either internal or external, that can be convened to review the current status of the ACI organization and make recommendations on future directions.
User groups: These groups can be based on a particular tool such as R, Python, or MATLAB and are an opportunity for users to share experience and expertise. The presence of a Facilitator at these meetings can be valuable, and Facilitators can use these meetings to obtain feedback on tools that are supported by the ACI organization. User groups can also be based on a specific domain of science.
Research lab or department level meetings: A facilitation engagement with users from a specific lab or department is another type of focus group at which a Facilitator can learn more about particular research goals and needs in order to determine steps that can assist the research group or department in taking their computational research to the next level. These meetings target multiple users with the same or similar needs and computational requirements and can be used to offer specialized training sessions aligned with the specific use cases of the group. In this manner, these visits often lead to deeper and more involved engagements and can help build a closer relationship with the group.
Jump to: top
Tools for Collecting and Analyzing Data
Once specific metrics and assessment data have been identified, the ACI organization can begin to look at how these can be collected and analyzed. There are many types of tools that can be used to accomplish this, and due to the variety of data to be collected, multiple tools are typically required. There may be institutional or ACI organization-level mandates on the applications used to collect data (e.g., the use of a specific ticketing system), or the Facilitator may decide on which tools to use. Independent of the tools used, it is crucial that the collection of metric and assessment data be performed in a manner that allows for easy aggregation and analysis in a consistent and reproducible manner to ensure that any conclusions drawn in the future will be comparable. No matter how much data is collected, the true measure of the worth of the data is in what is learned from its analysis.
In many cases, the tools used to collect metrics will also include functions to statistically analyze and prepare reports; if not, the data may have to be imported into a different application for analysis. Any analysis should include trends in the data which may be valuable when making decisions about the future direction of facilitation efforts, such as anticipating when certain facilitation activities are most needed. In addition, metrics on usage are valuable to aid in demonstrating the value of ACI resources to the institution.
The tools for collecting and analyzing data that are specifically named in this section are those that have been used by ACI-REF project teams. They are not recommendations and are not intended to be exhaustive. The collection and analysis examples follow the types of metrics and assessments that were defined in the Types of Metrics and Assessments sections above.
User base metrics
Most ACI organizations have their own practices for managing and organizing their user base that are often tied to their account creation mechanism. These metrics are typically collected within self-built databases that have been developed for collecting information about users who register for new ACI accounts and may include scripts to query the databases. In order to allow for meaningful analysis, in addition to user identity, an institution’s user base metrics should include the user’s department and college affiliation, their role at the institution (i.e., whether they are faculty, staff, or student), and possibly information about their project. In many cases, the additional information can be pulled directly from institutional level sources such as campus directories.
Demographic knowledge of new ACI users can facilitate the development of appropriate training and education strategies, whereas knowledge of the entire user base can be used to identify the departments with large numbers of users and, therefore, the applications and training sessions that may be of interest. Finally, knowing which departments are underrepresented with respect to ACI use enables Facilitators to focus their outreach efforts to increase awareness of the ACI resources.
Resource usage metrics
Tools for gathering resource usage metrics are often provided by the specific scheduler used to manage access to the resource or are self-built scripts that mine data from the scheduler or system logs. There are also tools such as the National Science Foundation funded, open source Open XDMoD (open.xdmod.org) that have been developed to be run with different resource managers in order to provide a wide range of metrics, including resource utilization and resource performance. Open XDMoD is currently being expanded to collect data on the impact on scholarship and research. The usage metrics can be combined with user based metrics and categorized by user, group, department, or college.
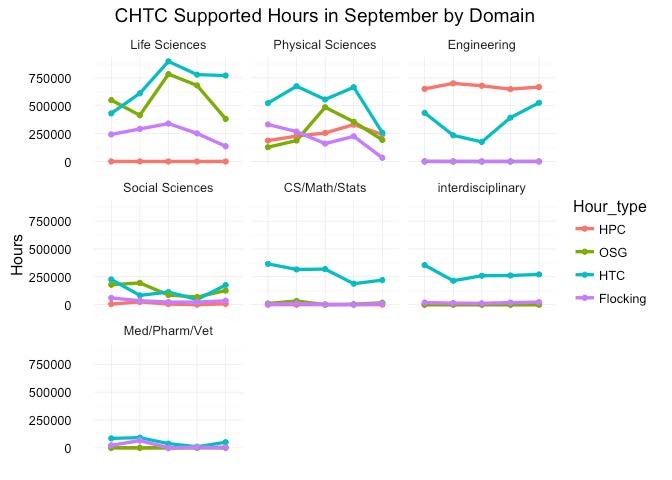
Figure 3: An example of one way to present ACI research usage hours
Facilitators can use resource usage metrics to provide input from a user’s perspective in the decision making process about need for additional and/or different resources and perhaps when to retire older resources. Metrics that include information about the type of resources used can help guide decisions about purchasing; for example, a longer wait time for jobs requesting the GPU nodes may indicate that it would be better to purchase additional GPU nodes as opposed to additional CPU nodes. The metrics can also be used by individual groups to determine whether or not they are in need of adding additional owner nodes in a condominium model or to determine the size of an allocation request. An in-depth analysis of usage may show that there is inefficient utilization of ACI resources and can be used to motivate targeted outreach and training to improve utilization. When combined with user base metrics, resource usage metrics can be analyzed to show usage distribution across research groups and departments which can be used to identify individual professors, department chairs, and deans when looking for support for the ACI organization. The example shown in Figure 3 was produced using software that was created for ACI-REF reporting8.
Facilitation metrics
Facilitation metrics are more complex due to the varied nature of facilitation efforts and require that the Facilitator take the time to properly document these efforts which may include resolving user issues, attending engagements with researchers, and providing education and training. An ACI-REF Facilitator has developed an R tool for reporting on facilitation metrics. The code is freely available through github at https://github.com/ChristinaLK/facilitation_reports .
User Issues and Assistance: Ticketing system tools such as Jira and ServiceNow – and open source alternatives such as Redmine, bugzilla, trac, and Mantis – are often used by ACI-REF organizations to track user issues and questions. They usually include built-in search and reporting utilities. Ticketing metrics include the number of questions answered, the type of questions asked, and information about the inquirer such as how many questions they asked and the department or project group to which they belong. Outside of ticketing systems, user assistance is often provided during office hours with tracking via sign in sheets, such as Google Sheets, or other one-on-one meetings which can be tracked in a calendar type application. An example of a table used to track user-related issues and assistances in show in Table 3.
Table 3. An example of using a bable to track user-related issues and assistance
| Staff | Start/ Enddate | User | Type | PI | Div Dept | Description | Comments |
| ACIREF | 11/30/16 12/7/16 | User Name | PI | Biology | Inefficient use of RAM on HPC | Trying to do R parallel but not working | |
| ACIREF | 11/25/16 11/25/16 | User Name | ticket | PI | Physics | Inefficient use of CPU resources | Large # of array jobs finishing too quickly (either computing or fail) |
| ACIREF | 1/16/17 | User Name | office hours | PI | LASN BISC | Needs help with PBS | Jobs required memory requests |
| ACIREF | 2/5/17 2/10/17 | User Name | lab consult | PI | ENGR BME | Wants to install python packages | Went through user install and setup |
An analysis of these can be used to identify common questions and complex issues. These can be used in turn to generate a FAQ list to which users can be referred. This type of analysis can also be used to direct the content of training sessions with the goal of reducing the repetitive basic questions that can take much of the Facilitator’s time.
Researcher engagements: As detailed in the Engagements and Implementing a Researcher’s ACI Plan chapters of this document, defining and following an established procedure to track researcher interactions is crucial. In some cases, the ticketing system can be used to generate a record of user engagements; in other cases, Facilitators use a separate tool for tracking engagements specifically. Optimally, the method used to track the engagements should include a mechanism that makes it easy to identify metrics such as their number of engagements and length of involvement for a given engagement and information about the researchers who were consulted. The method chosen should allow for the ability to follow the engagements of a particular user or group over time. This is discussed in more detail in the Implementation section of the Engagements with Researchers chapter.
Education and training (and outreach): The collection of metrics such as the number of events and the number of participants per event can be tracked using a simple spreadsheet. Any method should include information as to the date and the exact nature of the event. The number of participants can be collected at the event through the use of electronic registration, a sign-in sheets, or a simple count that the Facilitator makes at the activity. Using registration or sign-in sheets allows for the collection of data beyond the number of attendees such as names, departments, and email addresses for post workshop surveys. Alternatively, even if just names of the attendees are obtained, these metrics can be enhanced by looking up additional information such as their department or project group. An annotated record of monthly workshops in shown in Table 4.
Table 4. A typical example on documenting of Facilitation event metrics.
| ACIREF | Date Type | Title | Level | Registered | Attended Assessment | Target group | Additional comments |
| ACIREF | 11/3/2015 Training | Introduction to HPC | Beginner | 28 | 24 4.3 of 5 (n=22) | high # of experienced people | |
| ACIREF | 11/16/2015 Training | Intro to HPC+ MATLAB workflows | Beginner | 12 | 9 | Econ grad students |
Simple statistics that combine user base metrics and facilitation metrics can be used to answer questions such as “What percent of new ACI users have we engaged?” and “What percent of users have attended a training event?” The results can be further broken down by school and department to provide a measure of the distribution of engagement and training participants across an institution. Plotting dates and attendance rates of events will result in trends over an academic year, allowing for the determination of the interest level in specific training events and assisting in the planning of future training offerings both in terms of what to offer and when.
Facilitation Assessments
Survey tools like SurveyMonkey (www.surveymonkey.com), REDCap (www.project-redcap.org), and Qualtrics (www.qualtrics.com) can be used to obtain feedback about training and outreach events as well as user engagements, and polling tools like Poll Everywhere (www.pollev.com) can be used to obtain real time feedback of participants during the events. Tests to determine learning outcomes as the result of a training can be completed with an assessment tool such as quiz-maker ClassMarker (www.classmarker.com) or, alternately, with the use of generic applications such as Google Forms or a web form that can readily be adapted for completing a learning assessment.
An analysis of participant feedback as well as the results of learning assessments can be used to determine if the training being offered is meeting the needs of the user base and can determine gaps in training. In addition, the effectiveness of the delivery method (for example, presentation versus hands-on) chosen can be evaluated as can the content and level of the material presented.
Return on investment (ROI) metrics
For ROI metrics, institutions may have repositories or databases that can be mined to obtain information on publications and funding at a research-group level. Alternatively, individual departments or offices on campus may be of assistance in providing this information. For example, a department, college, or university may gather annual activity reports that include publications and funding information from their faculty members, or a contracts and grants officer may ask PIs who submit grant proposals if the proposed project will need access to research computing resources, providing a flag so that these projects can be readily aggregated by the ACI organization. Funding and publication information can also be gathered directly from the PIs or individual group members at regular intervals. Utah has implemented an Annual PI survey to obtain this information as well as other feedback on the use of the ACI resources offered. Funding information can also be obtained through sponsoring agency reporting tools such as the NIH reporter or through the NSF awards search engine.
Table 5. A typical example taken from an ACI-REF monthly report on metrics relating to return on investment, facilitation and resource usage.
| Campus/Measure | |
| Aggregate Number of ACI Users (Active) | |
| Total (10/2016) | 79 |
| Aggregate Number of Departments (Active) | |
| Total (10/2016) | 24 |
| External ACI Users | |
| Total (10/2016) | 0 |
| Research Dollars Awarded to ACI Users* | N/A |
| Publications* | 0 |
| Advanced Degrees* | 0 |
| Number of ACI-REF Consultations | 20 |
| Average Length of Engagement | 1 hour |
| User Affiliations of Consultations (List Below) | |
| Number of Training Sessions Offered | 2 |
| Attendees of Training Sessions | 9 |
| Attendee Satisfaction (List if you measured) | N/A |
| Core Hours Delivered (10/2016) | 3,258,685 |
User metric demographics can also be used to demonstrate the different areas of research across campus which are impacted by the availability of ACI resources and can be used to identify supporters or champions from new areas. An example of how this information can be reported is shown in Table 5. Finally, the use of reports from individuals highlighting how the use of ACI resources and/or facilitation was critical for accomplishing a specific research effort can be invaluable in showing impact.
Jump to: top
Summary
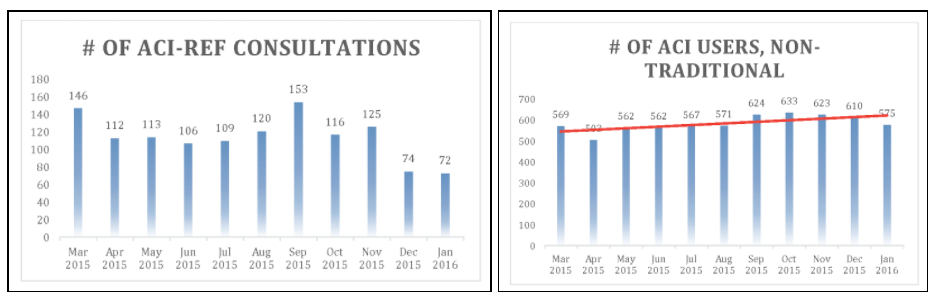 Figure 4: Bar charts showing aggregated facilitation and user base metrics from 2016 ACI-REF NSF Annual Report
The metrics and assessments described in this document have been critical in the evaluation of the ACI-REF project to compellingly demonstrate to its stakeholders (e.g., NSF, ACI organizations, campuses, community, etc.) that the project is meeting its stated goals. Per the project’s reporting requirements, agreed upon assessments and metrics were be gathered and recorded for monthly reports. Monthly reports were then aggregated and submitted as part of a summative yearly funding report. An example of how this data was aggregated to show consultation and non-traditional user trends is shown in Figure 4. The six universities agreed upon a set of specific metrics to be collected to facilitate the collation of the results and enable trends to be identified across sites. These metrics and they ways in which they were collected and analyzed improved over the course of the grant through discussions, working groups, and surveys.
Jump to: top
References
-
Frechtling, J. (2010). The 2010 User-friendly Handbook of Project Evaluation, Volume 2, Issue 57 of NSF (Series), National Science Foundation (U.S.). National Science Foundation, Directorate for Education and Human Resources, Division of Research and Learning in Formal and Informal Settings. ↩
-
Vanderbilt (2017) Online at http://virg.vanderbilt.edu/AssessmentPlans/Plan/Designing_an_Assessment ↩
-
Kirkpatrick, J.D. & Kirkpatrick, W.K. (2017). Online at http://www.kirkpatrickpartners.com/OurPhilosophy/ ↩
-
Figure from https://learningservicesucsd.wordpress.com/2014/12/03/kirkpatrick-levels-3-4-they-know-it-but-are-they-doing-it/ ↩
-
Wikipedia (2017) Online at https://en.wikipedia.org/wiki/Concept_inventory ↩
-
Stuckey, H. L. (2013) Three types of interviews: Qualitative research methods in social health. Methodological Issues in Social Health and Diabetes Research 1(2)(56-59). Online at http://www.joshd.net/article.asp?issn=2321-0656;year=2013;volume=1;issue=2;spage=56;epage=59;aulast=Stuckey.Turnbow, D. (2014). Assessment by design. Online at :https://learningservicesucsd.wordpress.com/2014/12/03/kirkpatrick-levels-3-4-they-know-it-but-are-they-doing-it/ ↩
-
Harvard (undated) Strategies for Qualitative Interviews. Department of Sociology. Online at http://sociology.fas.harvard.edu/files/sociology/files/interview_strategies.pdf. ↩
-
Koch, C.L. (2016) Facilitation Reports. GitHub, https://github.com/ChristinaLK/facilitation_reports.) ↩